GreptimeDB Enterprise Deployment Guide
Environment Requirements
- Docker >= v23.0.0
- kubectl >= v1.21.0
- Helm >= v3.0.0
- kubernetes >= 1.21
Overview
The GreptimeDB Enterprise Edition deployment includes the following components:
- GreptimeDB Operator: Used to interact with the Kubernetes cluster.
- KV Store: Used to store database metadata (supports cloud services or self-hosted). It is recommended to use RDS from cloud services such as AWS RDS PostgreSQL. Optional storage facilities include:
- PostgreSQL
- MySQL
- ETCD
- GreptimeDB Database Cluster, including the following components:
- Meta:Database cluster metadata management component
- Datanode:Data node
- Frontend:Entry point and protocol parsing node
- Flownode(optional): Stream computing node
- Vector Sidecar:Metrics collection agent
- GreptimeDB Standalone: Cluster self-monitoring storage node
- GreptimeDB Enterprise Dashboard
- Kafka(optional): Provides Remote WAL for GreptimeDB
- MinIO(optional): Provides object storage for GreptimeDB. It is recommended to use object storage from cloud services (e.g., AWS S3)
Components marked with * are optional:
| Pod Component Name | Replicas | CPU (Core) | Memory (GB) | Disk (Gi) |
|---|---|---|---|---|
ETCD* | 3 | 2 | 4 | 10 |
| GreptimeDB Operator | 1 | 1 | 1 | |
| Meta | ||||
| Datanode | ||||
| Frontend | ||||
Flownode* | ||||
| Vector Sidecar | ||||
| GreptimeDB Standalone | 1 | 4 | 8 | |
| GreptimeDB Enterprise Dashboard | 1 | |||
Kafka* | 3 | |||
MinIO* | 4 |
Deploy GreptimeDB Operator
Refer to GreptimeDB Operator Management Documentation for detailed installation steps.
Deploy ETCD (Option)
Refer to Manage ETCD for detailed installation steps.
Deploy Kafka (Option)
Refer to Deploy Kafka Cluster for detailed installation steps.
Deploy MinIO (Option)
Refer to Deploy MinIO Cluster for detailed installation steps.
Install and Start GreptimeDB
Obtain GreptimeDB Enterprise Edition Image
GreptimeDB Enterprise Edition is distributed as a Docker image. We provide each customer with a dedicated private Docker repository hosted on Alibaba Cloud. You can pull it directly using the docker pull command or configure it in the Helm chart.
You need to configure the image information in the Helm chart's values.yaml file to obtain your dedicated GreptimeDB Enterprise Edition, for example:
customImageRegistry:
  enabled: true
  # -- pull secret name, customizable, must match `image.pullSecrets`
  secretName: greptimedb-custom-image-pull-secret
  registry: <registry>
  username: <username>
  password: <password>

image:
  registry: <registry>
  repository: <repository>
  tag: <tag>
  pullSecrets:
    - greptimedb-custom-image-pull-secret
In the above configuration:
registry,username, andpasswordundercustomImageRegistryare used to create the Kubernetes pull secretregistry,repository, andtagunderimageare used to specify the GreptimeDB Enterprise Edition image- Therefore,
customImageRegistry.secretNameandimage.pullSecretsmust match to ensure correct authentication when pulling the image
Please contact Greptime staff to obtain the specific values for the above configuration items. When Greptime staff first deliver the GreptimeDB Enterprise Edition to you, they will inform you of the image registry address, username, and password via email or other means. Please keep this information safe and do not share it with external parties!
Configuration Management
Before installation, you need to create a file to configure the GreptimeDB cluster. Adjust it according to your Kubernetes environment. For more configurations, please refer to the documentation. Below is a reference configuration for greptimedb-cluster-values.yaml:
customImageRegistry:
  enabled: true
  # -- pull secret name, customizable, must match `image.pullSecrets`
  secretName: greptimedb-custom-image-pull-secret
  registry: <registry>
  username: <username>
  password: <password>

image:
  registry: <registry>
  repository: <repository>
  tag: <tag>
  pullSecrets:
    - greptimedb-custom-image-pull-secret

additionalLabels: {}

initializer:
  registry: docker.io
  repository: greptime/greptimedb-initializer
  tag: "v0.5.6"

# -- Meta configuration
meta:
  # -- Meta replicas
  replicas: 3

  backendStorage:
    # Optional
    # KV storage configuration, this configuration connects to ETCD
    etcd:
      endpoints: ["etcd.etcd-cluster.svc.cluster.local:2379"]
    # Below is an example using PostgreSQL as the KV store:
    # postgresql:
    #   host: "postgres.default.svc.cluster.local"
    #   port: 5432
    #   database: "metasrv"
    #   table: "greptime_metakv"
    #   electionLockID: 1
    #   credentials:
    #     secretName: "meta-postgresql-credentials"
    #     username: "root"
    #     password: "root"

  podTemplate:
    main:
      # Meta resource configuration
      resources:
        requests:
          cpu: '2'
          memory: 4Gi
        limits:
          cpu: '2'
          memory: 4Gi
    affinity:
      podAntiAffinity:
        preferredDuringSchedulingIgnoredDuringExecution:
          - podAffinityTerm:
              labelSelector:
                matchLabels:
                  app.greptime.io/component: greptimedb-meta
              topologyKey: kubernetes.io/hostname
            weight: 1

# -- Datanode configuration
datanode:
  # -- Datanode replicas
  replicas: 3

  # -- Datanode configuration
  configData: |-
    [[region_engine]]
    [region_engine.mito]
    write_cache_size = "20G"
    write_cache_ttl = "7d"

  podTemplate:
    main:
      # -- Datanode resource
      resources:
        requests:
          cpu: '8'
          memory: 16Gi
        limits:
          cpu: '8'
          memory: 16Gi
    affinity:
      podAntiAffinity:
        preferredDuringSchedulingIgnoredDuringExecution:
          - podAffinityTerm:
              labelSelector:
                matchLabels:
                  app.greptime.io/component: greptimedb-datanode
              topologyKey: kubernetes.io/hostname
            weight: 1
  # -- Datanode local disk configuration
  storage:
    storageClassName: null
    # -- Local disk size
    storageSize: 100Gi
    # -- Storage retain policy for datanode persistent volume
    storageRetainPolicy: Retain

# -- Frontend configuration
frontend:
  # -- Frontend replicas
  replicas: 3

  podTemplate:
    main:
      # Frontend resource
      resources:
        requests:
          cpu: '8'
          memory: 16Gi
        limits:
          cpu: '8'
          memory: 16Gi
    affinity:
      podAntiAffinity:
        preferredDuringSchedulingIgnoredDuringExecution:
          - podAffinityTerm:
              labelSelector:
                matchLabels:
                  app.greptime.io/component: greptimedb-frontend
              topologyKey: kubernetes.io/hostname
            weight: 1

# -- Flownode configuration
flownode:
  # -- Whether to deploy flownode
  enabled: false
  # -- Flownode replicas
  replicas: 1

  podTemplate:
    main:
      resources:
        requests:
          cpu: '8'
          memory: 16Gi
        limits:
          cpu: '8'
          memory: 16Gi

# -- Database self-monitoring configuration
monitoring:
  # -- Enable self-monitoring
  enabled: true
  standalone:
    base:
      imagePullSecrets:
        - name: "greptimedb-custom-image-pull-secret"
      main:
        # Self-monitoring resource configuration
        resources:
          requests:
            cpu: '4'
            memory: 8Gi
          limits:
            cpu: '4'
            memory: 8Gi
    # Self-monitoring standalone storage location, can be optionally configured for object storage
    # objectStorage:
    #   s3:
    #     secretName: "greptimedb-object-storage-secret"
    #     bucket: "greptimedb-bucket"
    #     region: "ap-southeast-1"
    #     root: "greptimedb-monitor-data"
    #     endpoint: "http://minio.minio:9000"
    # Self-monitoring local disk size
    datanodeStorage:
      fs:
        storageClassName: null
        storageSize: 100Gi
  # sidecar vector configuration
  vector:
    registry: docker.io
    repository: timberio/vector
    tag: 0.46.1-debian
    # sidecar vector resource configuration
    resources:
      requests:
        cpu: '1'
        memory: 1Gi
      limits:
        cpu: '1'
        memory: "1Gi"

# Object storage related configuration, enable as needed
# Using MinIO
# objectStorage:
#   existingSecretName: "greptimedb-object-storage-secret"
#   cache:
#     cacheCapacity: "50GiB"
#   s3:
#     bucket: "greptimedb-bucket"
#     region: "ap-southeast-1"
#     root: "greptimedb-data"
#     endpoint: "http://minio.minio:9000"

# Enable Enterprise Edition user and permission configuration
auth:
  enabled: true
  useBuiltIn: true
  mountPath: "/etc/greptimedb/auth"
  fileName: "passwd"
  users:
    # Default admin username, modify as needed
    - username: "superuser"
      # Initial admin account password, modify as needed
      password: "1fa44bbc-5ded-42bd-a3f1-c3621affce63"
      permission: "admin"

# Remote WAL related configuration, enable as needed
# remoteWal:
#   enabled: true
#   kafka:
#     brokerEndpoints:
#       - "kafka-broker-0.kafka-broker-headless.kafka.svc.cluster.local:9092"
#       - "kafka-broker-1.kafka-broker-headless.kafka.svc.cluster.local:9092"
#       - "kafka-broker-2.kafka-broker-headless.kafka.svc.cluster.local:9092"
Start GreptimeDB
Install the GreptimeDB cluster in the greptimedb namespace:
helm upgrade --install greptimedb \
  --create-namespace \
  greptime/greptimedb-cluster \
  -n greptimedb --values greptimedb-cluster-values.yaml
Verify the GreptimeDB installation:
kubectl get pod -n greptimedb
Expected output
NAME                                   READY   STATUS    RESTARTS   AGE
greptimedb-datanode-0                  2/2     Running   0          2m33s
greptimedb-datanode-1                  2/2     Running   0          2m33s
greptimedb-datanode-2                  2/2     Running   0          2m33s
greptimedb-frontend-74999c79cc-pzj8w   2/2     Running   0          17s
greptimedb-frontend-74999c79cc-rm2fb   2/2     Running   0          17s
greptimedb-frontend-74999c79cc-zbtdg   2/2     Running   0          17s
greptimedb-meta-56dc894867-jpt5c       2/2     Running   0          4m29s
greptimedb-meta-56dc894867-tpw4c       2/2     Running   0          4m29s
greptimedb-meta-56dc894867-wmh1t       2/2     Running   0          4m29s
greptimedb-monitor-standalone-0        1/1     Running   0          4m42s
Deploy Enterprise Dashboard
Configuration Management
Before installation, you need to create a file dashboard-values.yaml to configure the dashboard. Below is a configuration example:
replicaCount: 1

image:
  # Please contact Greptime staff for the value
  repository: <repository>
  tag: <tag>
  pullPolicy: IfNotPresent

imagePullSecrets:
  - name: greptimedb-custom-image-pull-secret

nameOverride: ""
fullnameOverride: ""

config: |
  servicePort: 19095
  logLevel: info
  enableLicenseManager: true
  enableUserAuthentication: true
  backendStore:
    type: sqlite
    sqlite:
      dataDir: /data
  provisionedInstances:
    - name: greptimedb
      namespace: greptimedb
      type: cluster
      settings:
        basic:
          url: http://greptimedb-frontend.greptimedb.svc.cluster.local:4000
          meta_url: http://greptimedb-meta.greptimedb.svc.cluster.local:4000
        monitoring:
          greptimedb:
            url: http://greptimedb-monitor-standalone.greptimedb.svc.cluster.local:4000
        license:
          secret_name: greptimedb-license
          secret_namespace: greptimedb

servicePort: 19095

serviceAccount:
  create: true
  annotations: {}
  name: ""

podAnnotations: {}

podSecurityContext: {}
  # fsGroup: 2000

securityContext: {}

service:
  type: ClusterIP
  port: 19095
  annotations: {}

resources:
  requests:
    cpu: '1'
    memory: 1Gi
  limits:
    cpu: '1'
    memory: 1Gi

nodeSelector: {}
tolerations: []
affinity: {}
Start Enterprise Dashboard
helm upgrade --install greptimedb-enterprise-dashboard \
  oci://greptime-registry.cn-hangzhou.cr.aliyuncs.com/charts/greptimedb-enterprise-dashboard \
  -n greptimedb \
  --values dashboard-values.yaml
Verify the Enterprise Dashboard installation:
kubectl get pod -n greptimedb | grep enterprise-dashboard
Expected output
greptimedb-enterprise-dashboard-67f498d6f9-n89z5 1/1 Running 0 27s
kubectl get svc -n greptimedb | grep enterprise-dashboard
Expected output
greptimedb-enterprise-dashboard ClusterIP 10.96.80.175 <none> 19095/TCP 89s
Log in to Enterprise Dashboard
Access port 19095 of the dashboard service to log in.
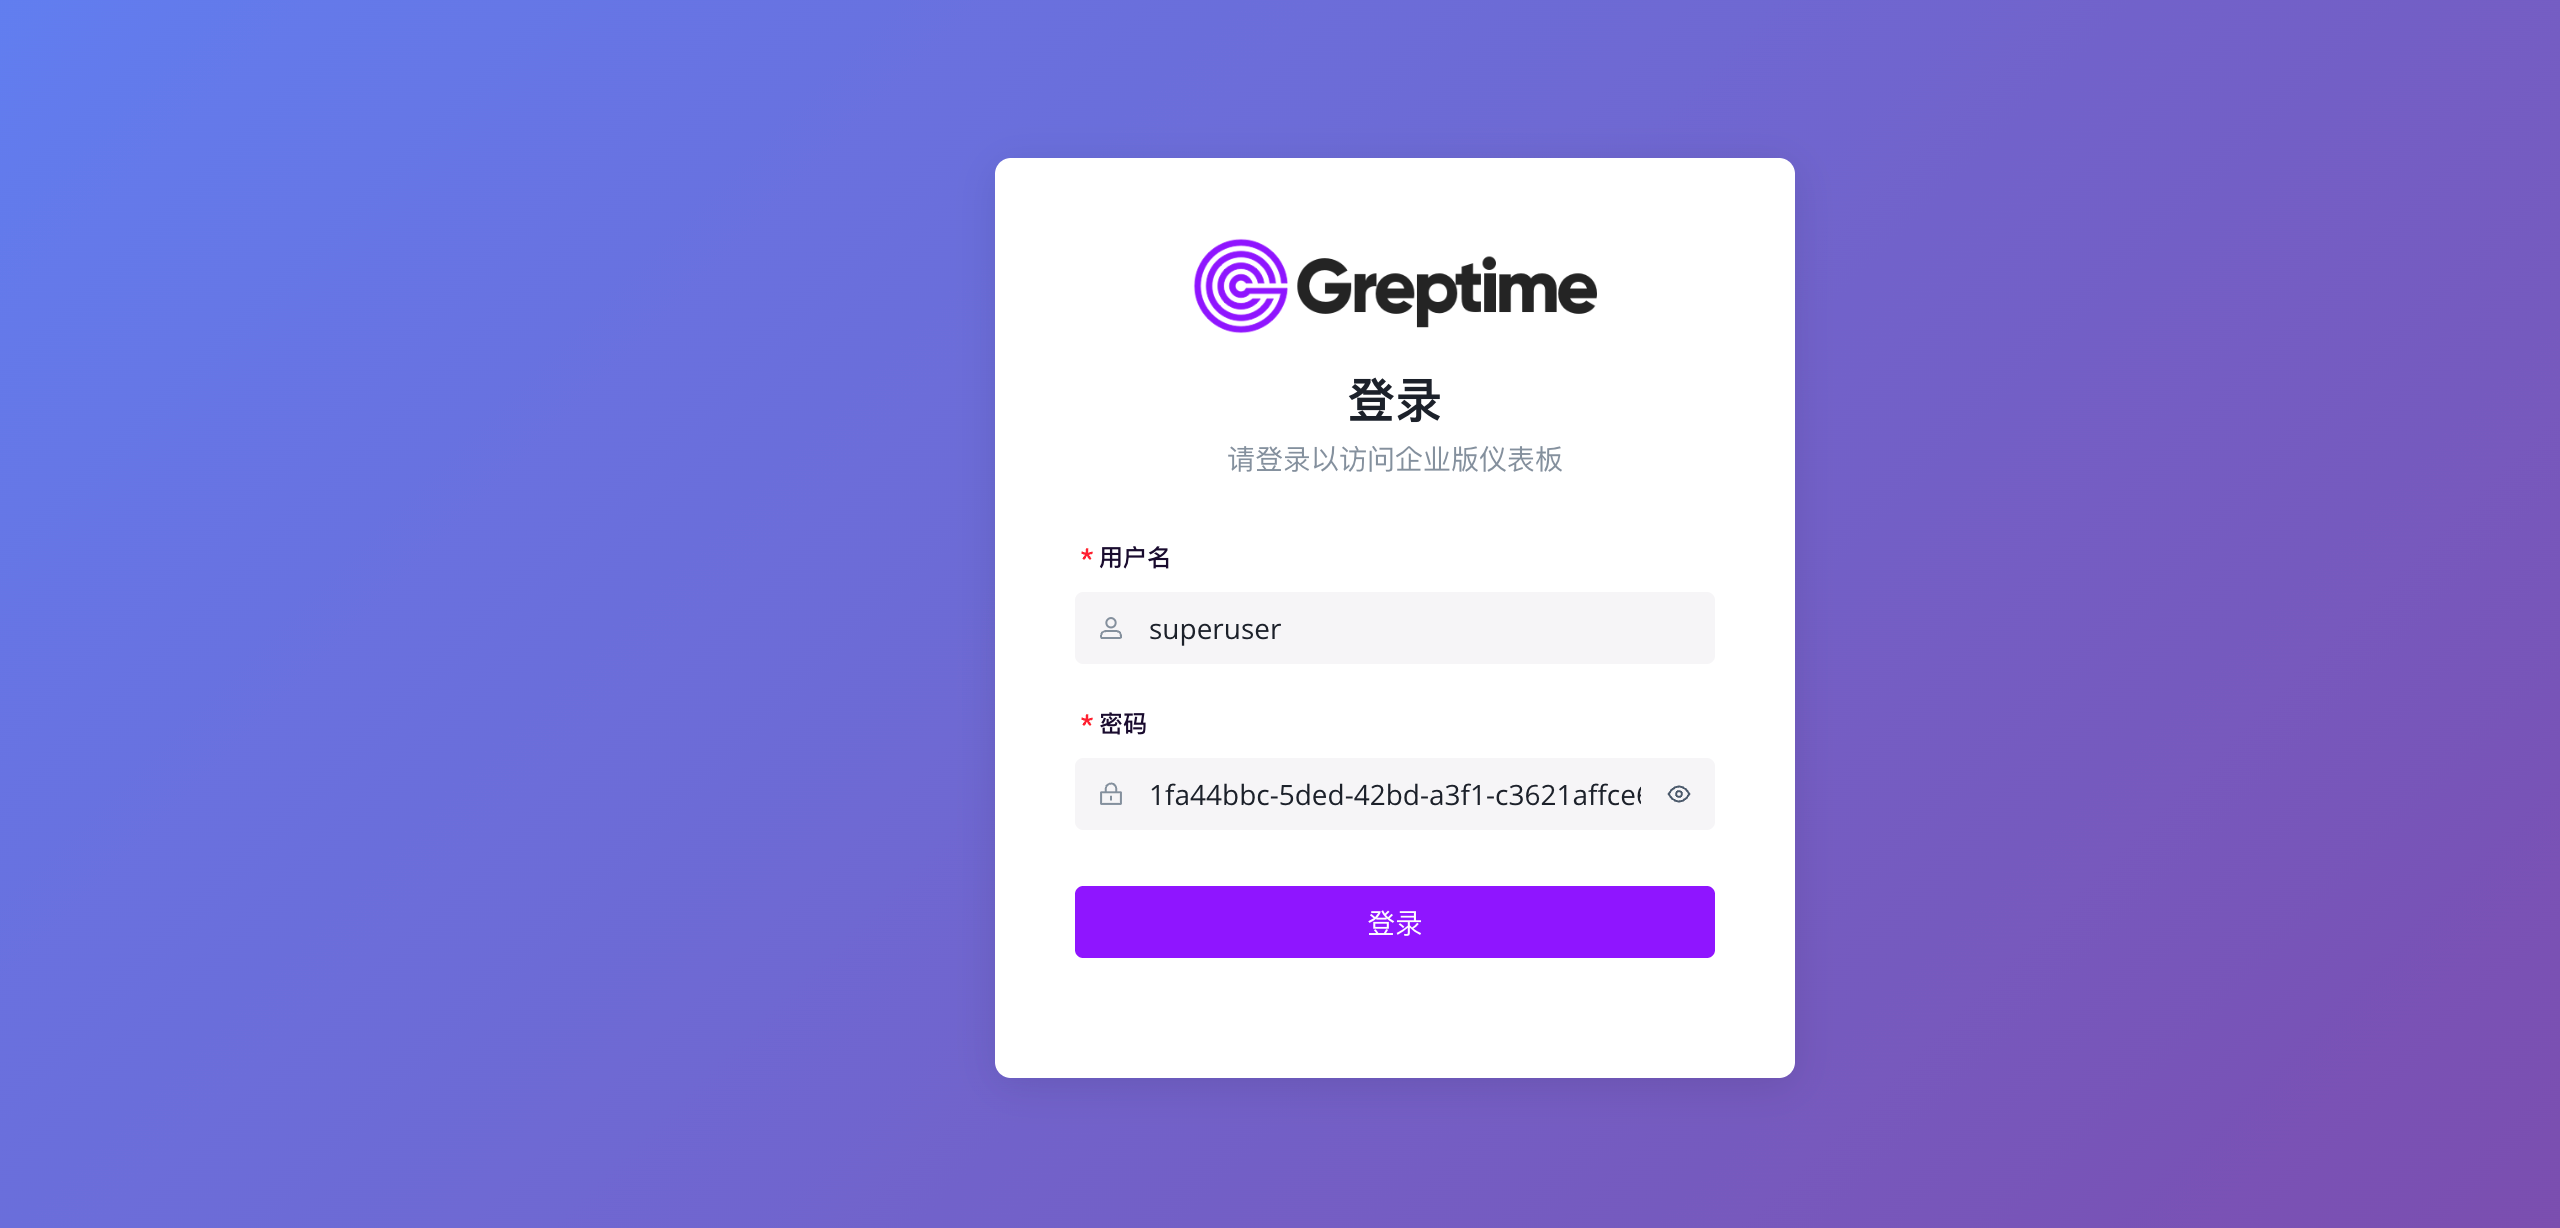
Log in using the superuser account and password from the database deployment. You will see:
- Query: Use SQL to query data
- Logs Query: Use the UI to query log tables
- Cluster Overview: Current cluster statistics
- Metrics Monitoring: Database cluster self-monitoring metrics
- Instance Logs: Database instance logs
- User Management: Add, delete, and modify user accounts